Data Job Salaries Dashboard
.png)
In this visualizaion project, I created a Tableau dashboard for Data related jobs with the ability to filter by salary, location, experience level, job role, and employment type.
In this visualizaion project, I created a Tableau dashboard for Data related jobs with the ability to filter by salary, location, experience level, job role, and employment type.
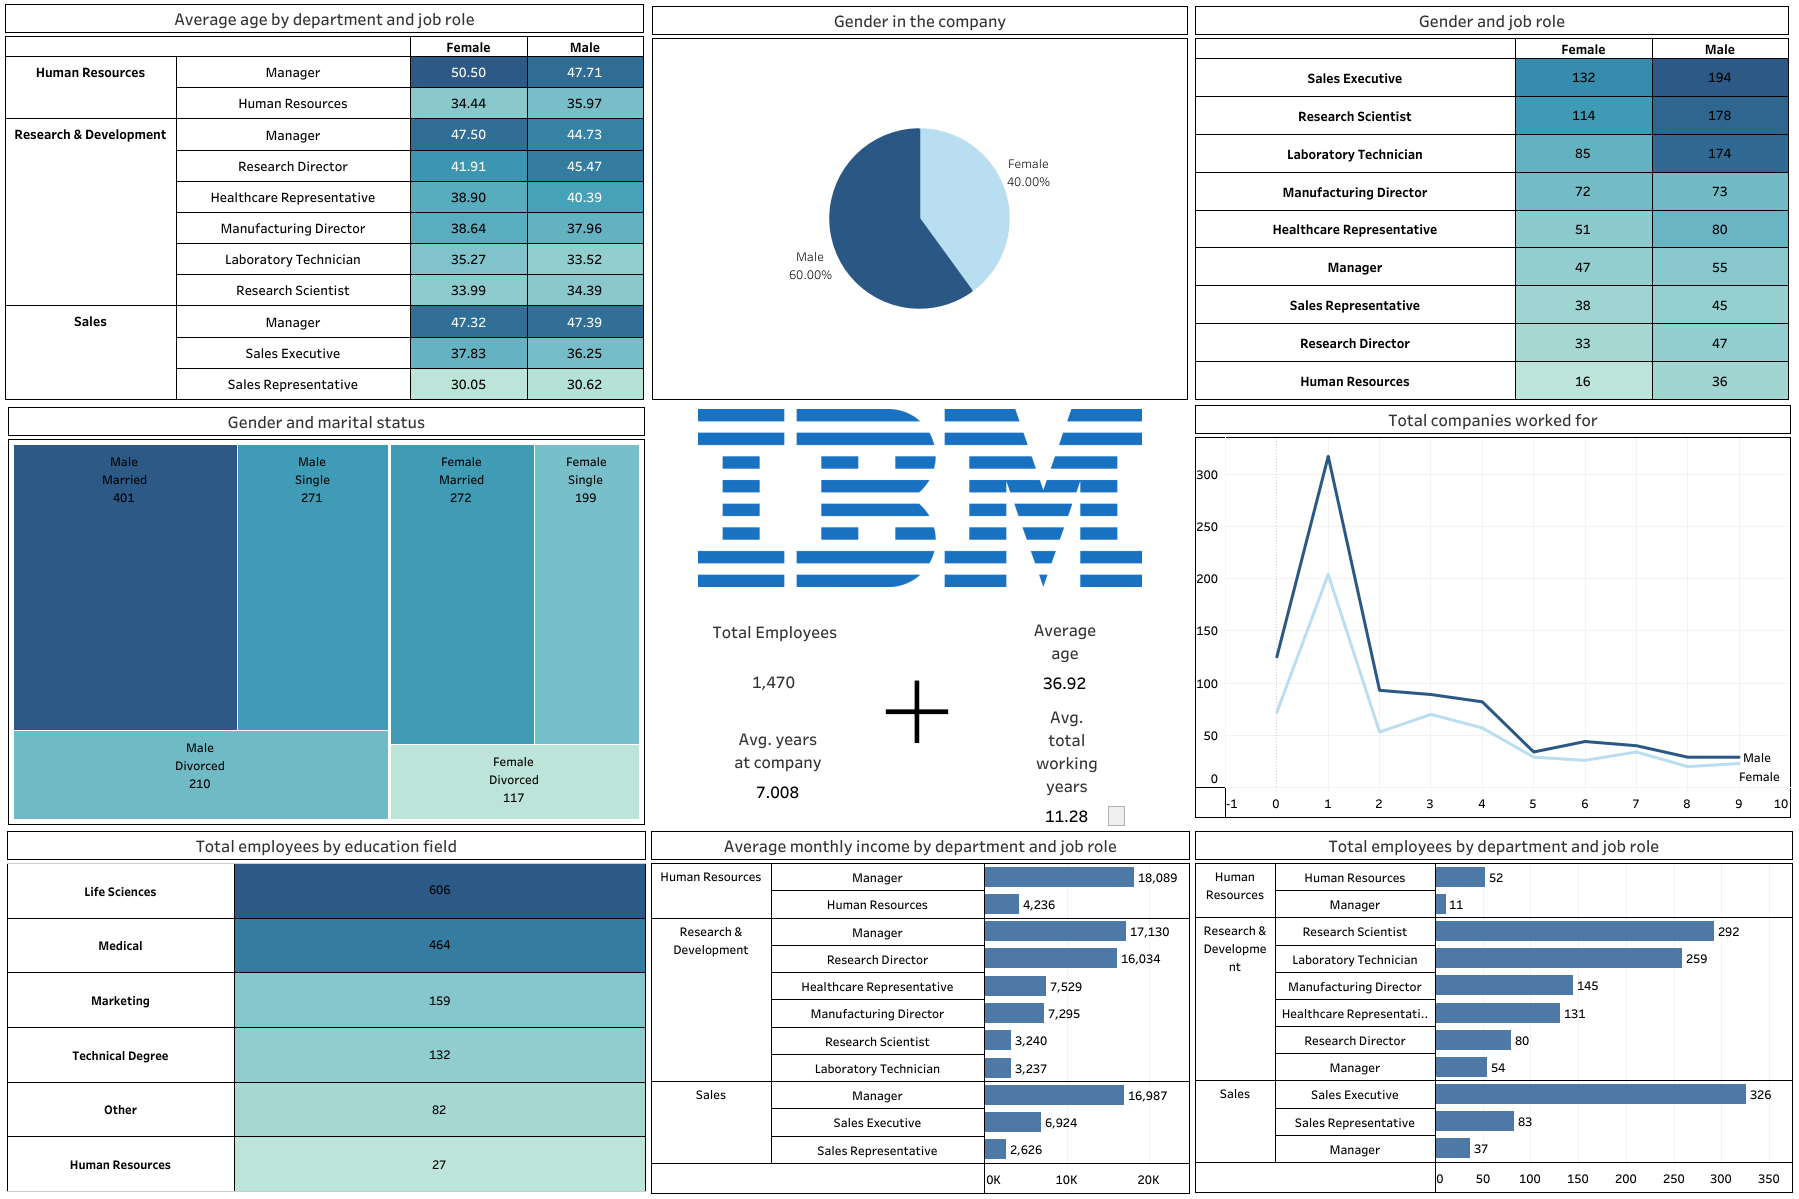
In this project, I utilized tableau to create and visualize an IBM dataset to showcase Human Resources related insights and demographics.
Data exploration is a crucial step in the data analysis process. In this project, we will explore the power of SQL as a tool for data exploration.


In this project, we will explore how Tableau can be used as a tool for creating insightful and appealing data visualizations.

Excel can be a powerful tool for organizing and managing data. In this project, we'll be using Excel for basic sorting and filtering to more advanced techniques like pivot tables, data validation, and dashboard visualization